


Debug2
Assumption Debug2 Panels expect to be working against saved Perl files
- tool-tips used extensively throughout so read them.
- Assumption you are aware of this: http://perldoc.perl.org/perldebug.html
- see Pro Perl Debugging http://www.apress.com/9781590594544 It's a nice text,
try working your way through Ch-04 in Padre for example
critiques welcome
Debug::Client
Please note version compatibility, it's important, you can check what version is installed in Padre by looking in Help -> About -> InformationDebug::Client 0.29 Padre 1.01 Debug::Client 0.29 Padre 1.00 Debug::Client 0.25 Padre 0.98 Debug::Client 0.20 Padre 0.96 Debug::Client 0.16 Padre 0.94
Tips
Warning if your script requires user input you should have "use external window for execution" checked.
- Make sure you can **Run** your script in Padre first, before you try to Debug it.
for start up parameters look at Tools -> Preferences -> language-Perl5: Perl-Arguments - Turn on $OUTPUT_AUTOFLUSH
- Try setting a breakpoint against 1; at end of your .pl files or equivalent, if you want to poke about with "p|x" before return or end
- Be patient;
- let Padre finish background tasks before launching debug
- let each action complete, before launching next
- remember it's using socket communications, hence ip time out :(
- $DB::single = 1; may be of use, go read :)
- If you use **Raw** it's all up to you, but the feedback will be interesting :)
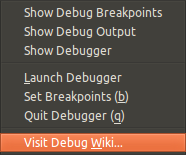
Menu
- The first three items relate to the Panels below.
- Launch (L), Breakpoints (b) and Quit (q) as per tool-bar
- Visit Debug Wiki, is here.
Tool-Bar
![]()
we only need 3 buttons on the tool bar, ( 3 on right )
- launch debugger ( launches Breakpoints & Debugger, enables tool-bar quit and then runs debug against current file )
- breakpoint toggle adds blue dotdotdot margin marker. (works with or without Breakpoints panel visible, so you can add BP's as you go)
- quit debugger ( initially greyed out )
NB. If you do not see the new icons, you will need to do the following, Tools->Preferences->Advanced->main_tool-bar_items Reset, for the three new tool-bar icons to appear
PS. icons will be greyed-out if Current file is not a Perl(mime-type) file.
Breakpoints
New in 0.97 when you click on a breakpoint point as in path/line, it now switches editor focus to file and line
if you do this whilst debugging, use the **dot** button in Debugger panel to show next line to debug.
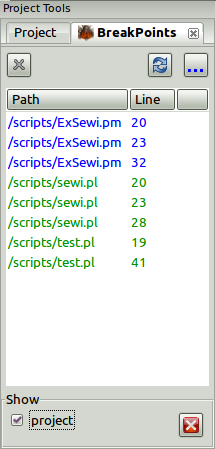
Top icons
- gray cross ( Delete MARKER_NOT_BREAKABLE Current File Only )
- refresh Ctrl-List
- Breakpoints ( Toggle ) also updates Ctrl-List and Margin Markers ( the blue dotdotdot co exist with diff markers )
Middle
- Current File (BLUE)
- MARKER_NOT_BREAKABLE (GRAY) ( dotdotdot margin markers are also gray )
- Project files (GREEN)
Bottom
- check Project show all files in current project with breakpoints
- if check projects, show delete all breakpoints in this project enabled.
- delete all breakpoints for when you need to delete all breakpoints in current project (project as in perl project)
NB
- Breakpoints are stored as absolute paths (debug will open files based on absolutes paths)
- Margin Marker Breakpoints piggy back on feature Syntax.
DebugBreakpoints
If you want to Peek inside the DB use Cookbook Recipe 04

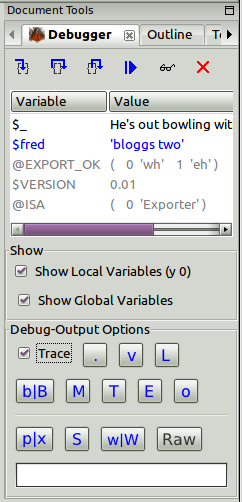
Debugger
When you "run debug" :)
- quit(q) is always visible, ( toolbar quit should now be enabled )
- the debugger will load breakpoints against the current file and it's project files, when it is load by the perl debug program, if you get it wrong, just adjust breakpoints as you go with b|B or quit and adjust breakpoints with panel and then re-run.
- new icons will only be visible when debug is running
step-in(s), step-out(n), step-over(r), run-till(c), glasses(p)
glasses, as per previous version, shown in black text ( if you select $_ remember DWISNWIM ) this is a persistent p :) - when perl debug is running the Debugger Output panel will be opened, initially with the perl debug help screen.
- note the green SMALLRECT in margin, showing debug position, as previously
Tip if you want to delay closing of debugger output, breakpoint the 1; at end of your file :) - As of Padre 0.95 you can now click on Variables and show values in Debugger Output in there corresponding colour
Why blue, I here you ask?, well others use yellow and red, but we have a wonderful blue Morpho butterfly :) hence blue
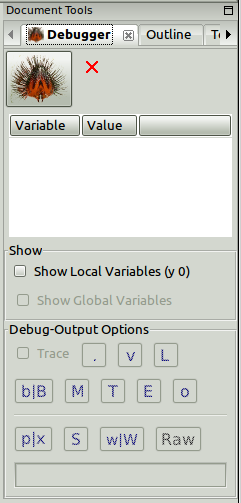
Show
- Show Local Variables(BLUE) is fixed to (y 0) local, as I don't know how to work out what level the debugger is at and how many levels there are, silly me
see Bugs & Limitations below. - Show Global Variables(GRAY) is doing X !(INC|ENV|SIG) against a current file which is also part of a perl project.
- I have been getting perl debug errors, see POD below, so you might notice it is automaticly disabled when I think it is unsafe, then re-enable.
- If you want to see @ISA|@INC|%ENV|%SIG use the p|x button.
Debugger-Output Options
My premises is that we are just wrapping the command line debugger, in a nice way, hence we will use the existing perl debug command language thus subliminally teaching the perl debug CLI instructions.
These options all display in the Debug-Output panel. some my consider these advanced, they do get more intense as you go down and to the right :)
Code Listing
- trace is a toggle against next action
- . => (dot) return editor to the next line to be executed
- v => view around line
- L => List (default all) actions, breakpoints and watch expressions
Default action only
- b|B => running Breakpoints, sets or unsets breakpoint (current line) against running debug as well as the normal Breakpoint actions above.
it finishes with a 'L b' if you want to see more use '.vL' to see for your self, - M => display loaded modules
- T => stack back-trace
- E => display thread id's (this seams a bit experimental at the moment, but here for completeness)
- o => Display all options
With value
- p|x => evaluate expression
- output shows 'expression = result'
tip turn Trace off - works with $ @ % also 2 + 3
- if empty returns $_ if exists or error :)
- output shows 'expression = result'
- S => RegEx
RegEx = !(IO::Socket|Carp) will hide Modules used by Debug::Client - w|W => watches
- add a watch (w exp)
- delete an existing watch (W exp)
- * delete all watches (W *)
- blank display watches (L w)
- Raw => pass expression directly to debug prompt (with out passing GO!) the side effects are not fully tested, we await your critiques
any thing you like:- x Object->new
- m Object
- if you use "o frame=nn" (nn<=30) this will cause y-0 to display garbage, you have been warned, so reset to "o frame=0" asap
- actions
- H if you want to see session History
- ... Oops yada-yada :)
- help last but not least, you can now enter 'h' or 'h h' and even 'h alpha' try the others first, it just makes sense to use h via Raw.
Musings: -,l ignored as we are in an IDE
Debugger Output
The output window is only shown when debug is running
- See below ( only displays current output )
- red text, I wonder what the inspiration was for this!
- Suggest you uncheck ( Padre -> View -> Unlock User Interface ) so you can enlarge view. the square is a toggle.
Screen Shots
Debug2
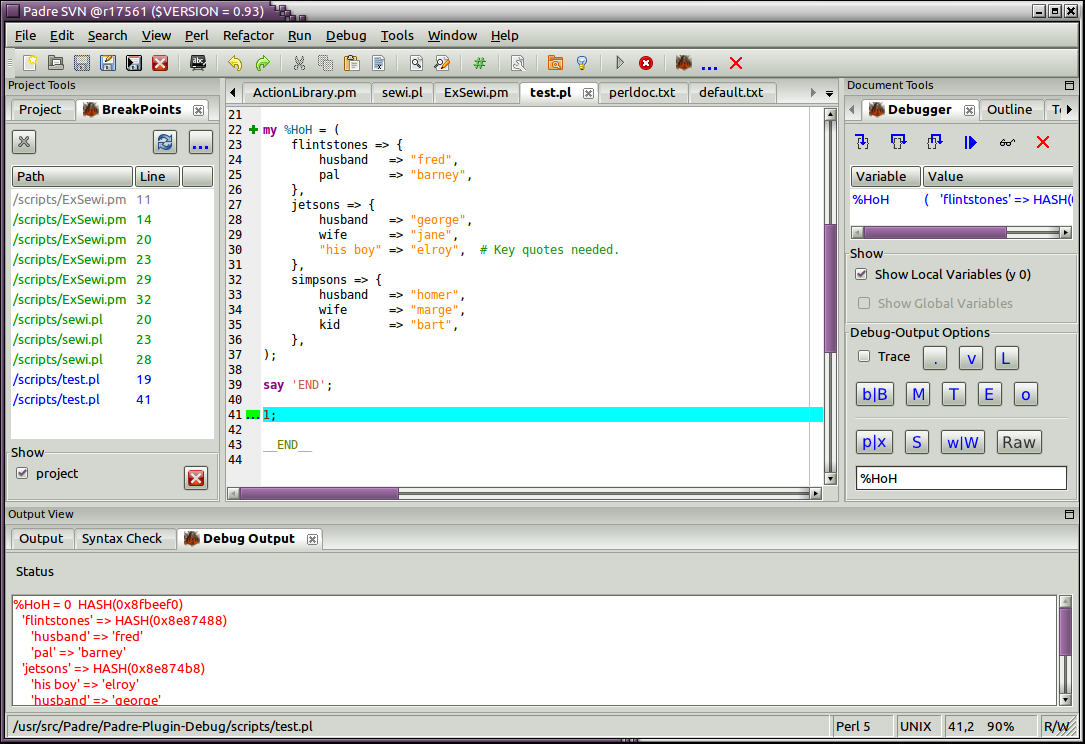
There is a lot going on in these slides, please notice the Debug-Output panel. In all cases the debugger has stopped after **c** continue(run-till).
slide 1
The use of p|x = %HoH
slide 2
The use of w|W = $_
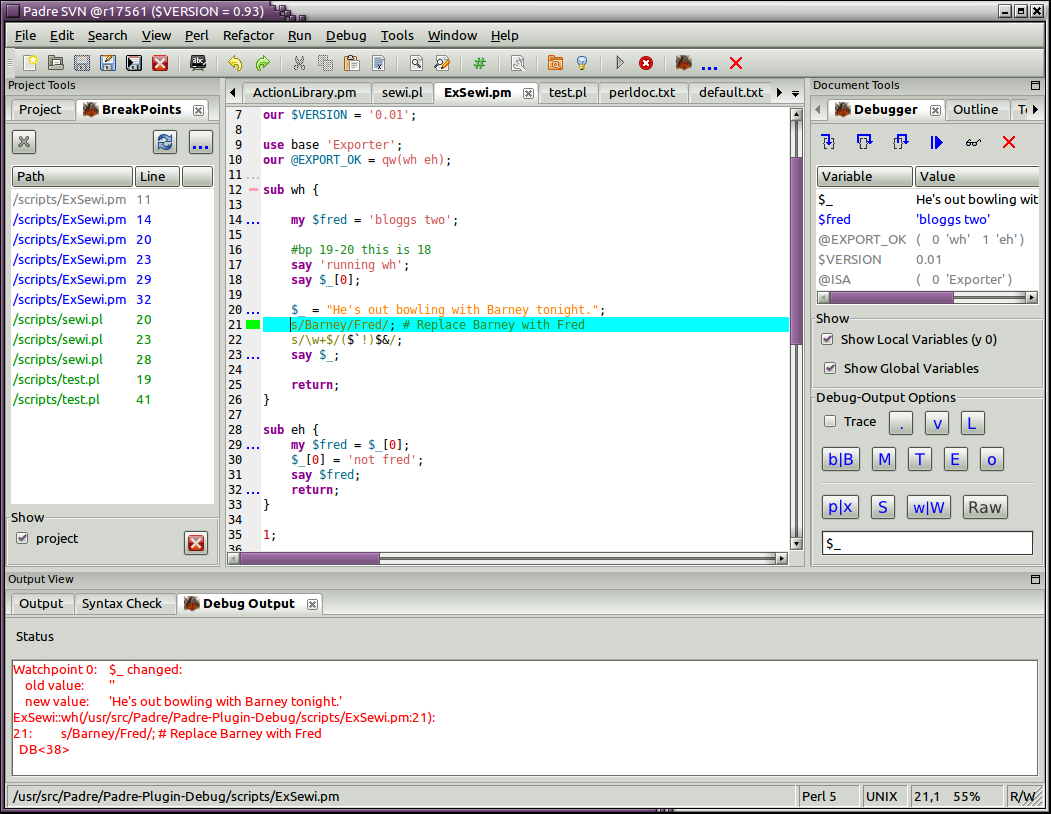
- NB look at the wasted screen real-estate in the bottom right hand corner, I suggest that we should extend the right hand panel down into this space?
- The example files used here are in attachments if you want to play.
Bugs & Limitations
Using Show Variables my cause the following, found Watch not to be displayed in Debug-Output, even though Debug2 has stopped at the correct place.
"Watchpoint 0:	@fonts changed:
    old value:	''
    new value:	'ARRAY(0x9060508)', 'ARRAY(0x9060498)'
main::CODE(0x95ba6d8)(/home/kevin/src/Padre/Padre-Plugin-Debug/scripts/test_1415.pl:63):
63:			say @fonts;
Using a Watch inside an ANON sub with Show Variables enabled may cause Padre to hang when clicking on Values in CtrlList, suggest you delete watch first. Suggest you don't enable Show Variables against an embedded watch in an ANON sub.
**NB fixed in trunk 0.97 with D-C 0.21_07 (see code snipet in #1415)**
TODO
- Colours from themes, thanks subT
- Conditional Breakpoints next overhaul or you could just use <Raw>
- Actions use **Raw**
POD from Main.pm
waiting until this Plug-in is working before migrating into Padre ( => 0.93 ) don't want to muck trunk.
To view Padre::DB::DebugBreakpoints use P-P-Cookbook::Recipie04 in trunk
We can now add and delete breakpoints via icon in debug simulation and Breakpoint panel.
Load breakpoints for current file, on load of Breakpoint panel.
Get breakpoint panel to only show current file and current project bp's only, inspired by vcs options
the debugger loads breakpoints from DB when started, for all files in current project. when debugger loads a new file ( current ) the current files BP's are add to the debugger, use L to see this.
changed breakpoint margin marker to ... so as to co-exist with diff margin markers, and avoid information contamination due to colour washout of previous SMALLRECT. Add Gray for not active with switched by debugger, also added new home made icons for step_....
add functionality from trunk so all icons mimic current debug implementation
look at displaying variables yes, but in a nice table (y 0) working
debug-output only viable when debugger running, on start of new debug first displays debugger help
Added buttons with colour letters to correspond to debuggers actions.
=head1 Feed Back
what options should be in Debugger Panel / Debug-Output Options
room for 3 more using coloured letters
=head1 BUGS AND LIMITATIONS
=head2 debug options X & V sometimes produce the following
	You can't FIRSTKEY with the %~ hash at /home/kevin/perl5/perlbrew/perls/perl-5.14.1/lib/5.14.1/dumpvar.pl line 380
		...propagated at /home/kevin/perl5/perlbrew/perls/perl-5.14.1/lib/5.14.1/perl5db.pl line 2438.
	 at /home/kevin/perl5/perlbrew/perls/perl-5.14.1/lib/5.14.1/perl5db.pl line 2438
		DB::DB called at sandbox 06 line 29
	Debugged program terminated.  Use q to quit or R to restart,
	  use o inhibit_exit to avoid stopping after program termination,
	  h q, h R or h o to get additional info.
Debug1
Debug::Client Padre up to and including 0.92 requires Debug::Client 0.12Debug::Client 0.12 Padre <= 0.92
Description
Run your code under a debugger with real-time display of results
TBD: Debugger supports Stepping, Breakpoints, Watches, Variable evaluation, Stack module #11
Planning for a new version of the debugger:
- The debugger can be launched by any of the following: Run / Step In / Step Over / Step Out / Run till breakpoint
- Run would stop at the first statement and it will be greyed out once the debugger is running
- Once the debugger is running the saved breakpoints of all the files belonging to this thing will be sent over.
- The question what does 'this thing' mean? Which files belong to the current run?
- Files that are currently open in the editor? File that belong to the current session? File in the current project?
- Movement: Step In / Step Over / Step Out / Run till breakpoint
- They do the corresponding action of the built in debugger
- Jump to current execution line ???
- Set a breakpoint (this should save the breakpoint in a config file and if the debugger is currently running then set the breakpoint in the debugger as well)
- How should a breakpoint remembered? Filename and line number? Filename and sub name?
- Remove breakpoint
- List all breakpoints ???
- Show trace - shows the current trace - it should open a window (maybe in the right-side window of the debugger) and constantly update the trace until the user turns it off.
- Display value - the selected variable, or the one that is under the cursor will be added to the right side where its value will be show every time the debugger pauses the execution
- Show Value now - show the value of the currently selected variable
- Evaluate Expression... opens a window where you can type in arbitrary perl expression for example:
- print 2 + 3
- $z = 42
- print $z
- Quit debugger ???
- Set watch - The user should be able to type in an arbitrary expression (if there was something selected then this will be the default) When that expression changes value the debugger will stop The expression should be saved belonging to the main script that is being executed. When the debugger is launched again these watch-points need to be set again (later we could display them to the user and ask the user if she wants to set them or not)
- Remove watch - remove an expression from the watch list (and from the saved watches)
Remember in database:
- filename - breakpoint - line number - condition
- main-file - expression to display (e.g. a variable name or a more complex expression)
- main-file - show stack trace on/off
- main-file - a history of expressions evaluated?
- main-file - a set of watches (conditional, non-location breakpoints)