The tool shows the layout (class, methods, functions, etc.) and will also show the list of variables declared in the code.
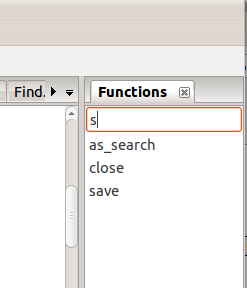
There are two tools to show the layout of the code. The simpler one is using a simple regex and shows only the functions in the current file. You can turn it on using View -> Show Functions. At the top of the window there is a search box for filtering the functions names. Clicking on the name of a function will let you jump to the definition of that function. There is currently no right-click support in this window.

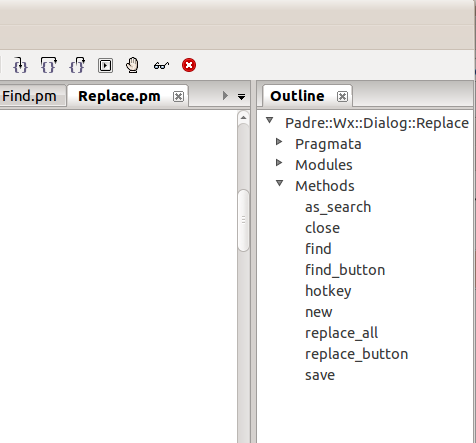
The more complex system is called Outline. You can turn it on via View -> Show Outline. It is using PPI hence it is slower and more CPU intensive but it is also more correct and it show additional information such as the name of the package, the list of pragmata, list of modules used, list of functions or methods declared in the file. Double-clicking on the items (or pressing ENTER) will let you jump to their definintion or to their use statement. Right-click on the entries will show a list of actions. Currently this includes ''Go to Element'' which is just the same as double-clicking on the item. Clicking on ''Open Documentation'' where available, will open the documentation of the specific pragmata or module. Unfortunately when closing the documentation it currently crashes Padre. ( #1178 )

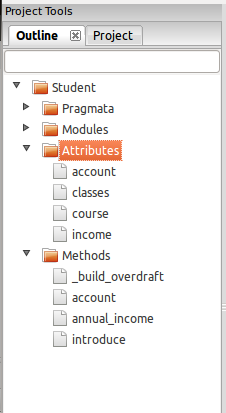
Padre 0.97+ showing Moose Methods and Attributes


